AESA based IPM
AESA based IPM
- About Agro-Ecosystem Analysis (AESA)
- Principles of AESA based IPM
- Grow a healthy crop
- Observe the orchard regularly (climatic factors, soil and biotic factors)
- Plant compensation ability
- Insect zoo
- Pest: Defender ratio (P: D ratio)
- Decision making
- Advantages of AESA over ETL
- FFS to teach AESA based IPM skills
- Field scouting
- Surveillance through pheromone trap catches for Cydia, Argyresthia, Archips, Apriona, Dorysthenes, and Lymantria
- Yellow/blue water pan and sticky traps
- Light traps
- Nematode extraction
About Agro-Ecosystem Analysis (AESA)
The IPM has been evolving over the decades to address the deleterious impacts of synthetic chemical pesticides on environment ultimately affecting the interests of the farmers. The economic threshold level (ETL) was the basis for several decades but in modern IPM (FAO 2002) emphasis is given to AESA where farmers take decisions based on larger range of field observations. The health of a plant is determined by its environment which includes physical factors (i.e. soil, rain, sunshine hours, wind etc.) and biological factors (i.e. pests, diseases and weeds). All these factors can play a role in the balance which exists between herbivore insects and their natural enemies. Understanding the intricate interactions in an ecosystem can play a critical role in pest management.
Decision making in pest management requires a thorough analysis of the agro-ecosystem. Farmer has to learn how to observe the crop, how to analyze the field situation and how to make proper decisions for their crop management. This process is called the AESA. Participants of AESA will have to make a drawing on a large piece of paper (60 x 80 cm), to include all their observations. The advantage of using a drawing is that it requires the participants/farmers to observe closely and intensively. It is a focal point for the analysis and for the discussions that follow, and the drawing can be kept as a record.
AESA is an approach, which can be gainfully employed by extension functionaries and farmers to analyse field situations with regard to pests, defenders, soil conditions, plant health, the influence of climatic factors and their inter-relationship for growing healthy crop. Such a critical analysis of the field situations will help in taking appropriate decision on management practices. The basic components of AESA are:
- Plant health at different stages
- Built –in-compensation abilities of the plants
- Pest and defender population dynamics
- Soil conditions
- Climatic factors
- Farmer past experience
Principles of AESA based IPM
Grow a healthy crop
- Select a variety resistant/tolerant to major pests
- Treat the seeds/seedlings/planting material with recommended pesticides especially bio-pesticides
- Select healthy seeds/seedlings/planting material
- Follow proper spacing
- Soil health improvement (mulching and green manuring wherever applicable)
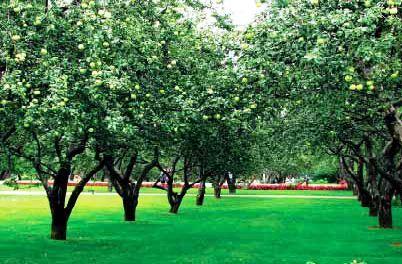
- Nutrient management especially organic manures and biofertilizers based on the soil test results. If the dosage of nitrogenous fertilizers is too high the crop becomes too succulent and therefore susceptible to insects and diseases. If the dosage is too low, the crop growth is retarded. So, the farmers should apply an adequate amount for best results. The phosphatic fertilizers should not be applied each and every season as the residual phosphate of the previous season will be available for the current season also.
- Proper irrigation
Observe the orchard regularly (climatic factors, soil and biotic factors)
Farmers should
- Monitor the field situation of the orchard at least once a week (soil, water, plants, pests, natural enemies, weather factors etc.)
- Make decisions based on the field situation and P: D ratio
- Take direct action when needed (e.g. remove infested plants)
Plant compensation ability
Compensation is defined as the replacement of plant biomass lost to herbivores and has been associated with increased photosynthetic rates and mobilization of stored resources from source organs to sinks (e.g., from roots and remaining leaves to new leaves) during active vegetative growth period. Plant tolerance to herbivory can arise from the interaction of a variety of plant traits and external environmental factors. Several studies have documented such compensation through increased growth and photosynthetic rate.
Understand and conserve defenders
- Know defenders/natural enemies to understand their role through regular observations of the agro ecosystem
- Avoid the use of chemical pesticides especially with broad-spectrum activity
Insect zoo
In orchard various types of insects are present. Some are beneficial and some may be harmful. Generally farmers are not aware about it. Predators (friends of the farmers) which feed on pests are not easy to observe in orchard. Insect zoo concept can be helpful to enhance farmers’ skill to identify beneficial and harmful insects. In this method, unfamiliar/unknown predators are collected in plastic containers with brush from the orchard and brought to a place for study. Each predator is placed inside a plastic bottle together with parts of the plant and some known insect pests. Insects in the bottle are observed for certain time and determined whether the test insect is a pest (feeds on plant) or a predator (feeds on other insects).
Pest: Defender ratio (P: D ratio)
Identifying the number of pests and beneficial insects helps the farmers to make appropriate pest management decisions. Sweep net, visual counts etc. can be adopted to arrive at the numbers of pests and defenders. The P: D ratio can vary depending on the feeding potential of natural enemy as well as the type of pest. The natural enemies of apple pests can be divided into 3 categories
- Parasitoids
- Predators and
- Pathogens
The general rule to be adopted for management decisions relying on the P: D ratio is 2: 1. However, some of the parasitoids and predators will be able to control more than 2 pests. Wherever specific P: D ratios are not found, it is safer to adopt the 2: 1, as P: D ratio. Whenever the P: D ratio is found to be favourable, there is no need for adoption of other management strategies. In cases where the P: D ratio is found to be unfavorable, the farmers can be advised to resort to inundative release of parasitoids/predators depending upon the type of pest. In addition to inundative release of parasitoids and predators, the usage of microbial bio pesticides and biochemical bio pesticides such as insect growth regulators, botanicals etc. can be relied upon before resorting to synthetic chemical pesticides.
Decision making
Farmers become experts in crop management
Farmers have to make timely decisions about the management of their crops. AESA farmers have learned to make these decisions based on observations and analysis viz. abiotic and biotic factors of the crop ecosystem. The past experience of the farmers should also be considered for decision making. However, as field conditions continue to change and new technologies become available, farmers need to continue improving their skills and knowledge.
- Farmers are capable of improving farming practices by experimentation
- Farmers can share their knowledge with other farmers
AESA methodology
- Go to the orchard in groups (about 5 farmers per group). Walk across the orchard and choose 10 trees /acre randomly. Observe the plant height, number of branches, crop stage, deficiency symptoms etc.
- Collect 5-6 samples/tree (fruits/leaves/ flowers/inflorescence/stem bark/roots/soil/insects) i.e. one sample from top, four samples from all the four sides (North, South, East, West) and one from bottom/soil. Observe keenly each of these samples and record your observations:
- Pests: Observe and count pests.
- Defenders (natural enemies): Observe and count parasitoids and predators.
- Diseases: Observe and identify any visible disease symptoms and severity.
- Weeds: Observe weeds in the field and their intensity.
- Water: Observe the water situation of the field.
- Weather: Observe the weather condition.
- While walking in the orchard, manually collect insects in plastic bags. Use a sweep net to collect additional insects. Collect plant parts with disease symptoms.
- Find a shady place to sit as a group in a small circle for drawing and discussion.
- If needed, kill the insects with some chloroform (if available) on a piece of cotton.
- Each group will first identify the pests, defenders and diseases collected.
- Each group will then analyze the orchard situation in detail and present their observations and analysis in a drawing (the AESA drawing).
- Each drawing will show a tree representing the orchard situation. The weather condition, water level, disease symptoms, etc. will be shown in the drawing. Pest insects will be drawn on one side. Defenders (beneficial insects) will be drawn on another side. Write the number next to each insect. Indicate the plant part where the pests and defenders were found. Try to show the interaction between pests and defenders.
- Each group will discuss the situation and make an orchard management recommendation.
- The small groups then join each other and a member of each group will now present their analysis in front of all participants.
- The facilitator will facilitate the discussion by asking guiding questions and makes sure that all participants (also shy or illiterate persons) are actively involved in this process.
- Formulate a common conclusion. The whole group should support the decision on what fi eld management is required in the AESA plot.
- Make sure that the required activities (based on the decision) will be carried out.
- Keep the drawing for comparison purpose in the following weeks.
Data recording
Farmers should record data in a notebook and drawing on a chart. Keeping records of what has happened help us making an analysis and draw conclusions
Data to be recorded
- Plant growth (weekly): Height of plant; Number of leaves
- Crop situation (e.g. for AESA) : Plant health ; Pests, diseases, weeds ; Natural enemies ; Soil condition ; Irrigation ; Weather conditions
- Input costs: Seeds; Fertilizer; Pesticides; Labour
- Harvest: Yield (Kg/acre); Price of produce (Rs. /Kg)
Some questions that can be used during the discussion
- Summarize the present situation of the orchard?
- What crop management aspect is most important at this moment?
- Is there a big change in orchard situation compared to last visit? What kind of change?
- Is there any serious pest or disease outbreak?
- What is the situation of the beneficial insects?
- Is there a balance in the orchard between pests and defenders?
- Were you able to identify all pests and diseases?
- Do you think the orchard is healthy?
- What management practices are needed at this moment?
- When will it be done? Who will do it? Make sure that responsibilities for all activities are being discussed.
- Are you expecting any problems to emerge during the coming week such as congenial weather conditions for pest buildup?
- What problems? How can we avoid it? How can we be prepared?
- Summarize the actions to be taken.
Advantages of AESA over ETL
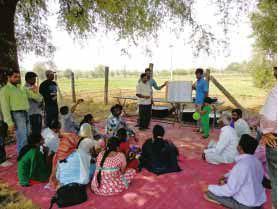 One of the problems of the ETL is that it is based on parameters that are changing all the time, and that are often not known. The damage or losses caused by a certain density of insects cannot be predicted at all. In ETL the due recognition of the role of natural enemies in decreasing pest population is ignored. Farmers cannot base their decisions on just a simple count of pests. They have to consider many other aspects of the crop (crop ecology, growth stage, natural enemies, weather condition, etc.) and their own economic and social situation before they can make the right crop management decisions. In ETL based IPM, natural enemies, plant compensation ability and abiotic factors are not considered. In AESA based IPM emphasis is given to natural enemies, plant compensation ability, abiotic factors and P: D ratio.
AESA and farmer field school (FFS)
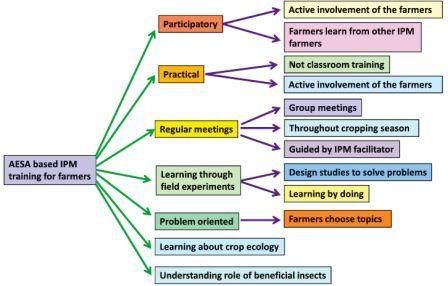
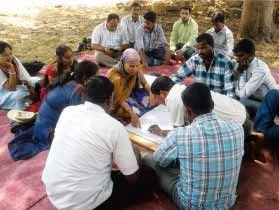 AESA is a season-long training activity that takes place in the farmer field. It is season-long so that it covers all the different developmental stages of the crop and their related management practices. The process is always learner-centered, participatory and relying on an experiential learning approach and therefore it has become an integral part of FFS.
Farmers can learn from AESA
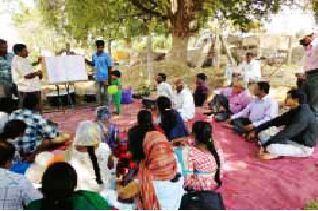 Identification of pests and their nature of damage
- Identification of natural enemies
- Management of pests
- Water and nutrient management
- Influence of weather factors on pest buildup
- Role of natural enemies in pest management
FFS to teach AESA based IPM skills
Field scouting
AESA requires skill. So only the trained farmers can undertake this exercise. However, other farmers also can do field scouting in their own orchards at regular intervals to monitor the major pest situation. Surveillance on pest occurrence in the orchard should commence soon after crop establishment and at weekly intervals thereafter. In each orchard, select five spots randomly. Select five random plants at each spot for recording counts of insects as per procedure finalized for individual insects.
Sampling in fruit crops
In orchard, select five trees such that four are from four corners and one from the centre of the orchard. Two rows of trees alongside of boundary of orchard in all directions should not be selected for observations. The tree selection for pest observations during each weekly visit should be random. In each of the selected trees, the observations are to be made from four directions viz., East, South, West and North (make it a habit to start at East direction of a tree and follow anticlockwise direction). Use either beat or tap method for taking observations on pest’s samples.
For insect pests
- Woolly apple aphids, San Jose scales, and mites: Count and record the number of both nymphs and adults on five randomly selected leaves per plant.
- Blossom thrips: Count and record the number of nymphs and adults of thrips present on fi ve terminal leaves per plant (tapping method also can be used to count thrips).
- Apriona, Dorysthenes, Lymantria: Number of larvae of Apriona (stem borer), Dorysthenes (root borer) and Lymantria (foliage feeder) on individual plants should be counted using a suitable procedure.
For diseases
Whenever scouting, be aware that symptoms of plant disease problems may be caused by any biotic factors such as fungal, bacterial, viral pathogens or abiotic factors such as weather, fertilizers, nutrient deficiencies, pesticides and abiotic soil problems. In many cases, the cause of the symptom is not obvious. Close examination, and laboratory culture and analysis are required for proper diagnosis of the causal agent of disease. Generally fungal diseases cause the obvious symptoms with irregular growth, pattern & colour (except viruses), however abiotic problems cause regular, uniform symptoms. Pathogen presence (signs) on the symptoms can also be observed like fungal growth, bacterial ooze etc. Specific and characteristic symptoms of the important plant diseases are given in description of diseases section.
- Root sampling: Always check plants that appear unhealthy. If there are no obvious symptoms on plants, examine plants randomly and look for lesions or rots on roots and stems. Observe the signs of the causal organism (fungal growth or ooze). It is often necessary to wash the roots with water to examine them properly. If the roots are well developed, cut them to examine the roots for internal infections (discoloration & signs). Count the total number of roots damaged/infested/infected due to rot should be counted and incidence should be recorded.
- Leaf sampling: Examine all leaves and/or sheaths of each plant for lesions. Leaf diseases cause most damage during the seedling and flowering stages of plant growth. Observe for the symptoms and signs on the infected plant parts. Determine the percent area of leaf/sheath infection by counting the number of leaves (leaf area diameter)/plant infected due to disease and incidence should be recorded.
- Stem, flower and fruit sampling: Carefully examine the stem, flower and fruit of plants for symptoms and signs of fungal or bacterial diseases. The stem, flower and fruit should be split or taken apart and examined for discoloration caused by fungi and bacteria. Count the number of stems, flowers and fruits infected due to disease and percent disease incidence should be recorded.
For weeds
The goal of weed scouting is to assess the infestation level of known weeds as pests and detect new weeds that may be at very low levels so that action can be taken to control or prevent them from becoming an economic concern. In some cases, early detection of a weed can make eradication possible.
Begin scouting as soon as weeds appear in the field and continue until freeze-up. Record stages of growth of all the weeds and the number of each weed species/square metre.
Frequently, all scouting patterns must be used since weed habitat can be very species specific. Each field usually requires a pattern for a uniform sample and samples in low areas and field margins or ditches to assess immediate or future risk from problem weeds left uncontrolled. Detailed counts of the number of weeds per square metre provide the ideal record of a weed problem. If this is not possible, the following rating system may be useful:
Group I - Wild oats, stinkweed, wild buckwheat, lamb’s-quarters, redroot pigweed, hemp-nettle, smartweed, rape, wild mustard, Russian thistle, tartary buckwheat, cow cockle, shepherd’s-purse, kochia.

Group II - Chickweed, green foxtail, corn spurry.

Group III - Canada thistle, sow-thistle, dandelion

These definitions can be used to help standardize ratings. With experience, infestations can be visually estimated. These groupings are based on the competitive characteristics and life cycles of these weeds.
Surveillance through pheromone trap catches for Cydia, Argyresthia, Archips, Apriona, Dorysthenes, and Lymantria
Pheromone traps @ 4-5/acre have to be installed, if available, for Cydia, Argyresthia, Archips, Apriona, Dorysthenes and Lymantria. Install the traps for each species separated by a distance of >75 feet. Fix the traps to the supporting pole at the height of mid canopy. Change of lures should be made at 2-3 week interval (regular interval) or based on loss of lure effi cacy. During each week of surveillance, the number of moths/trap/week should be counted and recorded year round. The trapped moths should be removed and destroyed after each recording.
Yellow/blue water pan and sticky traps
Set up yellow water pan/sticky traps for monitoring woolly apple aphids and blue water pan/sticky traps for blossom thrips at the height of mid canopy @ 4-5 traps/acre. Locally available empty tins can be painted yellow/ blue and coated with grease/Vaseline/castor oil on outer surface may also be used.
Light traps
Set up light traps @ 1 trap/acre at the height of mid canopy for monitoring and mass trapping insects. Light traps with exit option for natural enemies of smaller size should be installed and operate around the dusk time (6 pm to 10 pm).
Nematode extraction
Collect 100 to 300 cm3 (200-300 g) representative soil sample. Mix soil sample and pass through a coarse sieve to remove rocks, roots, etc. Take a 600 cc subsample of soil, pack lightly into a beaker uniformly. Place soil in one of the buckets or pans half filled with water. Mix soil and water by stirring with paddle; allow to stand until water almost stops swirling. Pour all but heavy sediment through 20-mesh sieve into second bucket; discard residue in first bucket; discard material caught on sieve. Stir material in second bucket; allow to stand until water almost stops swirling. Pour all but heavy sediment through 200-mesh sieve into first bucket; discard residue in second bucket. Backwash material caught on 200-mesh sieve (which includes large nematodes) into 250-ml beaker. Stir material in first bucket; allow to stand until water almost stops swirling. Pour all but heavy sediment through 325-mesh sieve into second bucket; discard residue in first bucket. Backwash material caught on 325-mesh sieve (which includes small to mid-sized nematodes and silty material) into 250-ml beaker. More than 90% of the live nematodes are recovered in the first 5-8 mm of water drawn from the rubber tubing and the sample is placed in a shallow dish for examination.
Source: NIPHM and Directorate of Plant Protection, Quarantine & Storage
ਆਖਰੀ ਵਾਰ ਸੰਸ਼ੋਧਿਤ : 1/11/2022
Provides information about Solar Insect Trapper - ...
